<
Work Home

Breaking down Open AI's Consumer PnL + Potential ARPU Expansion

1. What Sam's tweet hinted

Sam Altman Tweet

When Sam Altman proposed converting the current $20/month plan into a credit based pricing system it highlighted two critical points:

Monthly subscription =! Perceived value.

Most good subscription businesses struggle to fully capture the perceived value of their product from each user segment, since a single price often oversimplifies diverse usage patterns. A credit-based system makes complete economic sense - ties price more directly to actual consumption. Heavy users who derive more value pay proportionally more, while lighter users aren't overcharged.

Higher margins = Lower cash burn

This combined with the fact that OpenAI is reportedly burning $5B in cash (driven largely by compute and research expenses), shifting toward a credit-based model can help up those contribution margins and reduce some of the burn.

Market Data

Together, these signals suggest that a flat fee alone is most likely suboptimal, and that a dynamic, usage-based component could help OpenAI strategically better match revenue with actual compute consumption.

2. Breaking down the OpenAI Consumer PnL

Before designing any pricing experiment, I believe it's important to understand the PnL and unit economics at a granular level.


WHY? My experience leading Strategy at Swiggy (India's DoorDash) taught me that a PnL is like a clue sheet - if you read it correctly, it reveals not just what's happening, but why. Presenting that story in the right way to the rest of the organization anchors everyone to the same goals and priorities.


OpenAI has three business lines - Consumer, Enterprise, and API. CFO Sarah Friar recently mentioned publicly that the Consumer segment accounts for about 75% of overall revenue. So I decided to narrow in on the Monthly Consumer PnL and examine the Consumer unit economics to create a view on which levers most impact revenue and margin, and ultimately design the most potent experiment.

OpenAI Consumer PnL

At a high level I began by segmenting the PnL across the three different consumer tiers - Free, Plus, and Pro - each with distinct usage patterns and price points. To keep it simple and focussed on levers that we will be controlling through our experiment, I have not included Microsoft's revenue share and CapEx allocation.


TAKEAWAYS:

  • Plus users are the economic engine: it represents only 5% of users yet delivers the lion's share of contribution margin.
  • The Free tier, while huge in numbers, runs at a small negative margin (-$3.2M), effectively acting as a top-of-funnel loss leader.
  • Pro, meanwhile, posts near-breakeven margin (-$0.4M) despite its much higher subscription fee - highlighting that heavier usage at the Pro level quickly offsets incremental revenue.

I also calculated how each model profitability looks across different subscription tiers. By isolating margins at this granular level, we can spot where usage costs overwhelm revenue versus where margins remain strong.

OpenAI Model Profitability

TAKEAWAYS:

  • Knowing which features bleed margin versus those that drive profitability is crucial for designing targeted experiments. These will serve as important success metrics for our experiment design.
  • Deep Research for Pro is hemorrhaging margin at -146%, while almost every other model and tier combination remains solidly profitable.

Below, I will break down how I came up with these numbers. Please note that most of the numbers are based on educated assumptions. For this exercise, I have focussed more on the logic, approach, and financial model and have kept the assumptions dynamically linked.


MODELLING THE USER BASE

OpenAI Usage Model OpenAI User Base Model
  • Assumed a starting base of monthly users
  • Assumed a 20% growth
  • Assumed and modelled a monthly churn% across different tiers
  • Assumed certain plan downgrades
  • Monthly Active Users for Feb = Jan Base + Growth - Plan level Churn + Downgrades

This is how I defined churn rates:

OpenAI Churn Rates Definition

The churn definitions for Plus and Pro focus on payment status, ensuring revenue accuracy in the P&L, but they delay the recognition of cancellations, which may understate churn intent.


As an org, we should also track a separate metric for cancellations (e.g., users who cancel in February but are still active due to payment) to see a leading indicator of forecasted churn.


TAKEAWAY: Growth, retention, churn, cancellation % at a consumer tier level are important L2 metrics that should be used as check metrics for any ARPU expansion experiment.


MODELLING THE COST OF SERVICING USERS


To understand the cost dynamics, I analyzed the variable costs of servicing queries across OpenAI's consumer tiers. I started by mapping:


  • Each tier's access to specific models
  • Estimated number of queries based on model usage across tiers (assumption)
  • Using OpenAI's API pricing as a guide and estimated tokens for each model interaction, calculated the cost per query for each model and tier combination
  • Finally, Total Cost / User = Per-query costs * average monthly query volume
  • Since there wasn't a lot of info on Deep Research and SORA costs, I have assumed
    • Deep research = 5x of standard costs
    • SORA = 10x of 4o costs
OpenAI Model Costs OpenAI Token Costs

TAKEAWAY:

  • Pro incurs outsized costs - particularly from high-compute models, where monthly usage can easily top 100+ queries at a steep per-query rate. The Plus tier - at an average customer cost of $6 - displays strong margins

CALCULATING THE MODEL LEVEL PROFITABILITY

To pinpoint which models are profitable and which are drains on margin, I next attributed both the total monthly revenue and total monthly costs at the model level. On the revenue side, I attributed a subscriber's monthly fee to a specific model based on how many queries they ran on each model. On the cost side, it was more straightforward and direct - I used the same query counts but multiplied by the specific per-query/compute cost for each model-tier combination:

OpenAI Revenue Attribution
  • High-Margin Models: Standard models (e.g., 4o or o3) delivered margins of up to ~99%.
  • Loss-Making Features: "Deep Research" in the Pro tier showed a -146% margin. Total costs were as high as $140M - reflecting how a handful of heavy, high-compute use cases can overwhelm the flat subscription fee.

3. Understanding User Sentiment Before Designing the Experiment

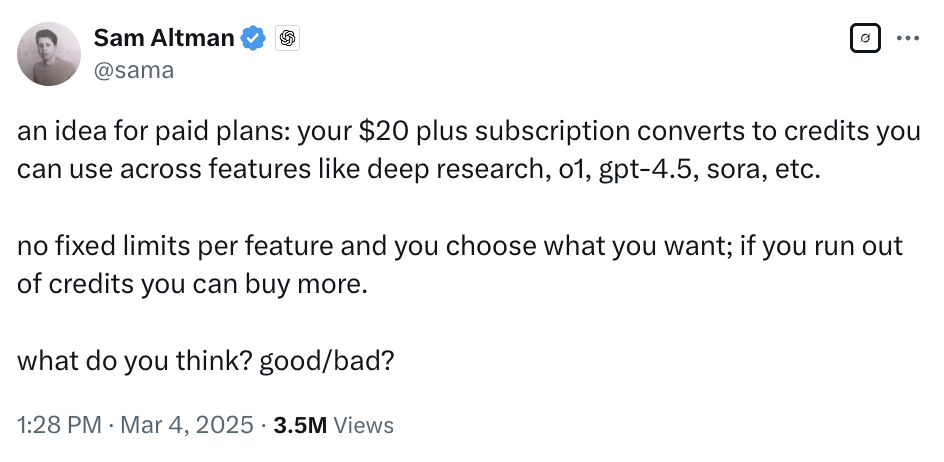
Before jumping into a pricing experiment, I wanted to understand how users felt about transitioning to a credit-based model.

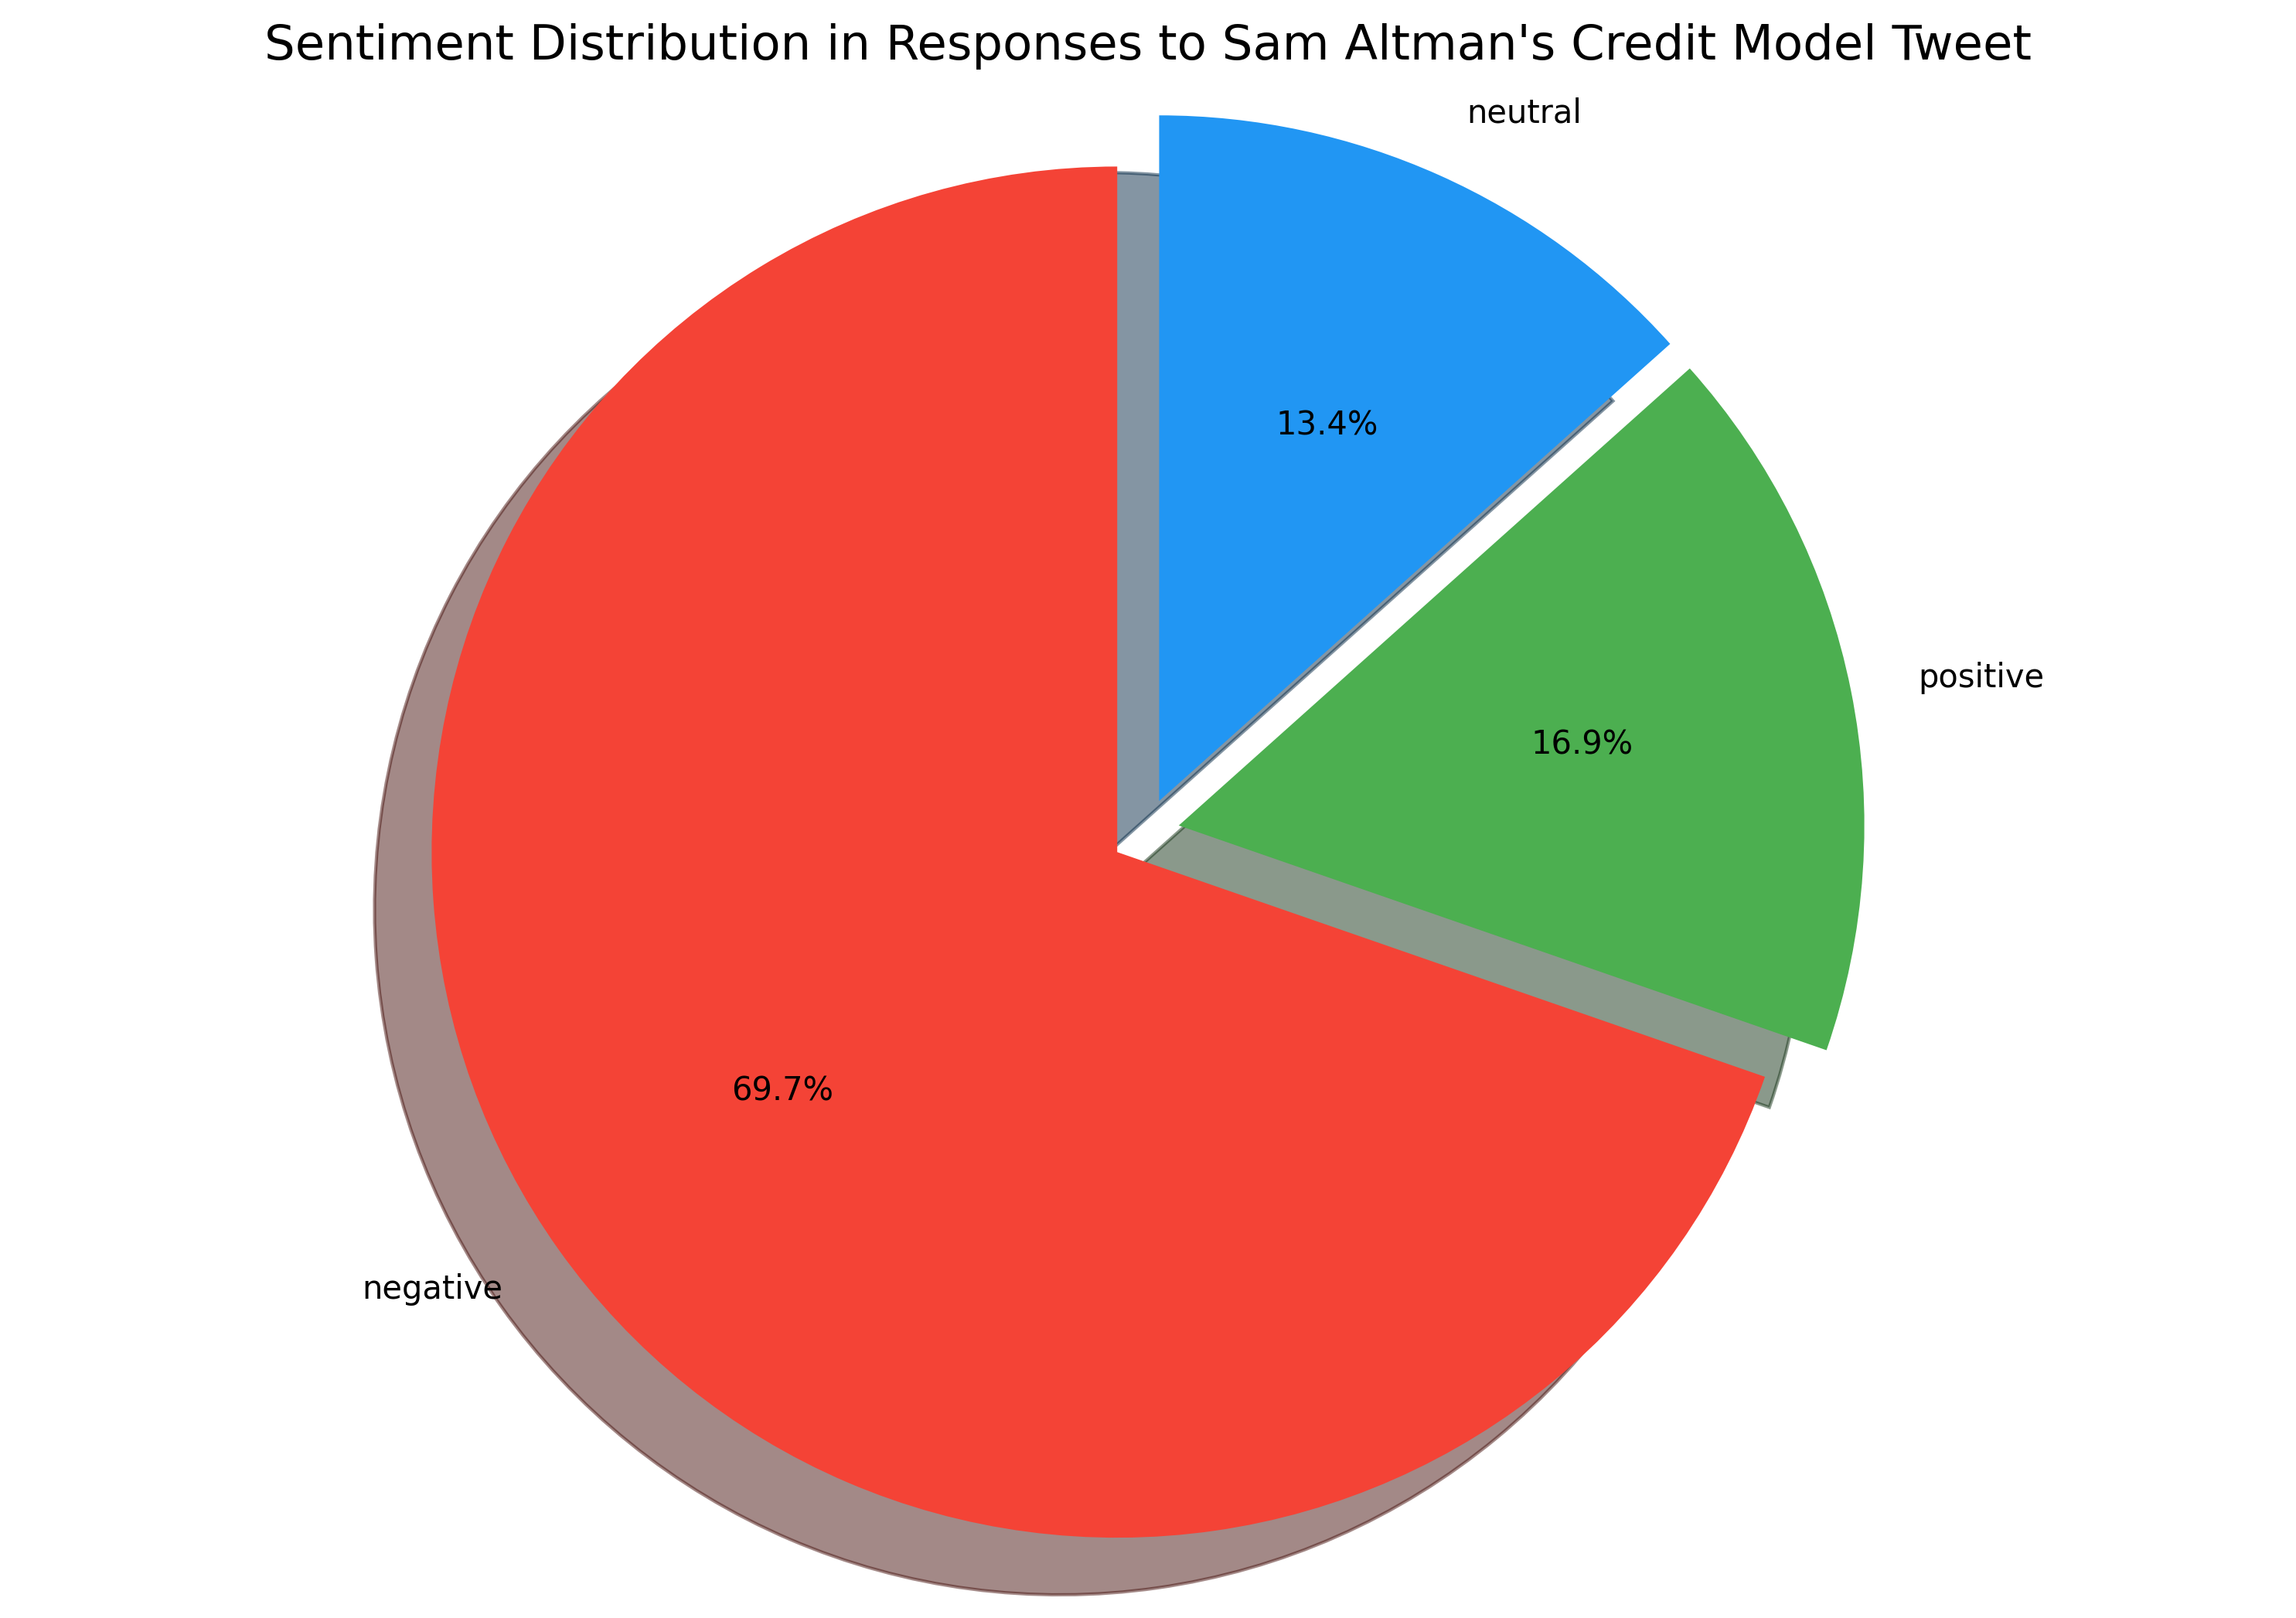
For this I analyzed the top 250 comments on Sam Altman's tweet and grouped them into sentiment categories:

Sentiment Analysis of User Comments

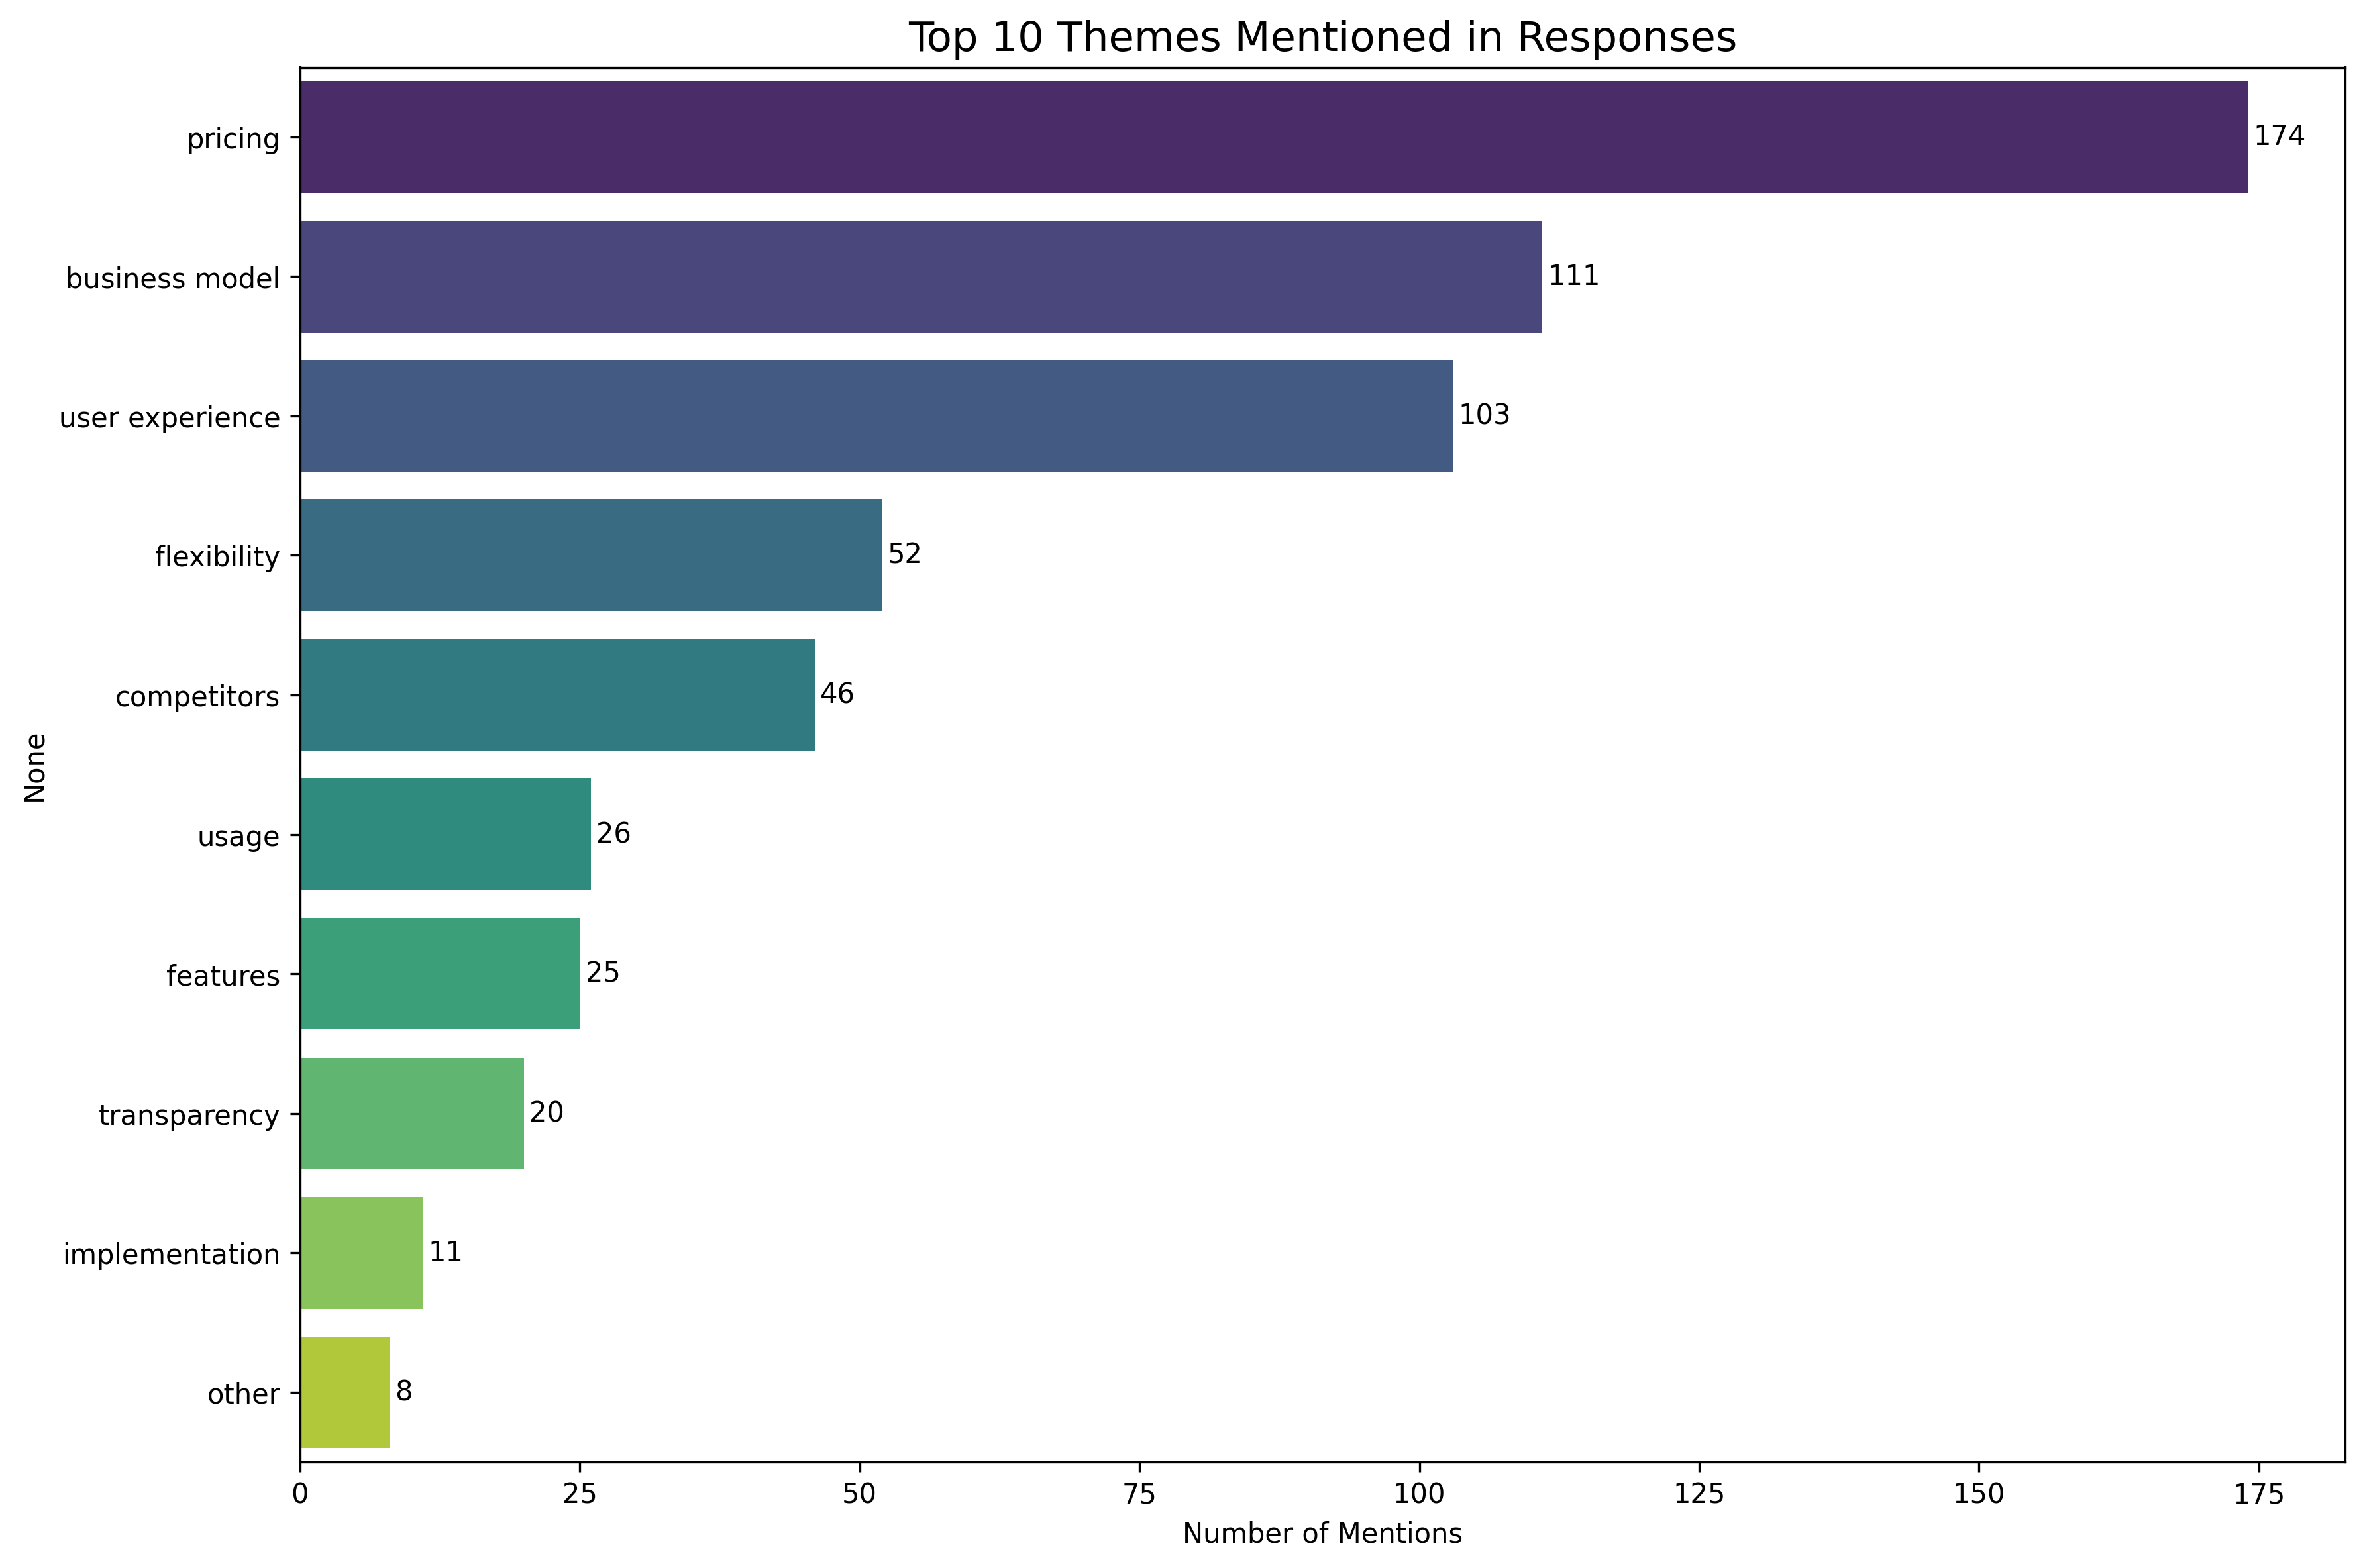
Roughly 70% were negative, 17% positive, and 13% neutral - indicating overall skepticism toward the idea of credits. Following were the issues:

Themes in User Comments

Pricing and business model here reflect an overall psychological dislike towards a credit based pricing model. Below are some of the tweets that highlight this:


"Every platform I have used that does this, I unsubscribe. This will hurt daily users pockets"


"Consumers will find metering confusing. There will be different prices, and people don't understand why."


"I, like any sane individual, utterly despise credit systems. It is introducing a new unknown. At least with a monthly sub - I know my cash flow."


But 30% of the tweets also had suggestions:


"Offer unlimited access to base features, limited access to advanced features, and pay-per-use option for advanced features with cost estimates shown in advance."


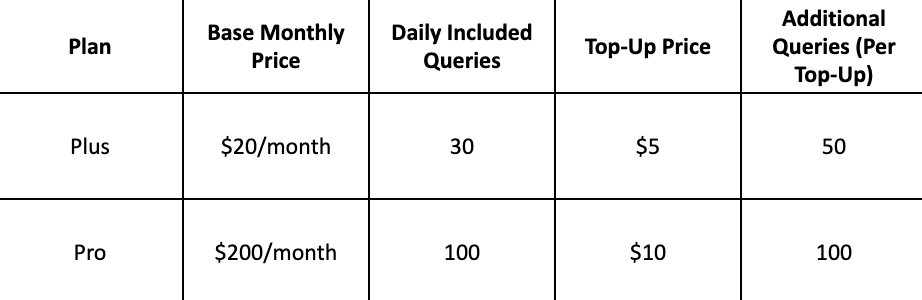
"Keep current $20/month limits, but allow users to top up another $20 to extend usage across all features. Use cost ratios for each feature behind the scenes to balance usage."


"Use top-ups instead of credits"


"Use an add-on subscription model instead, with unlimited access to specific features for an additional monthly fee, while maintaining basic access to all features."


"Keep the current system the same and add an option to purchase additional usage limits."


TAKEAWAYS:

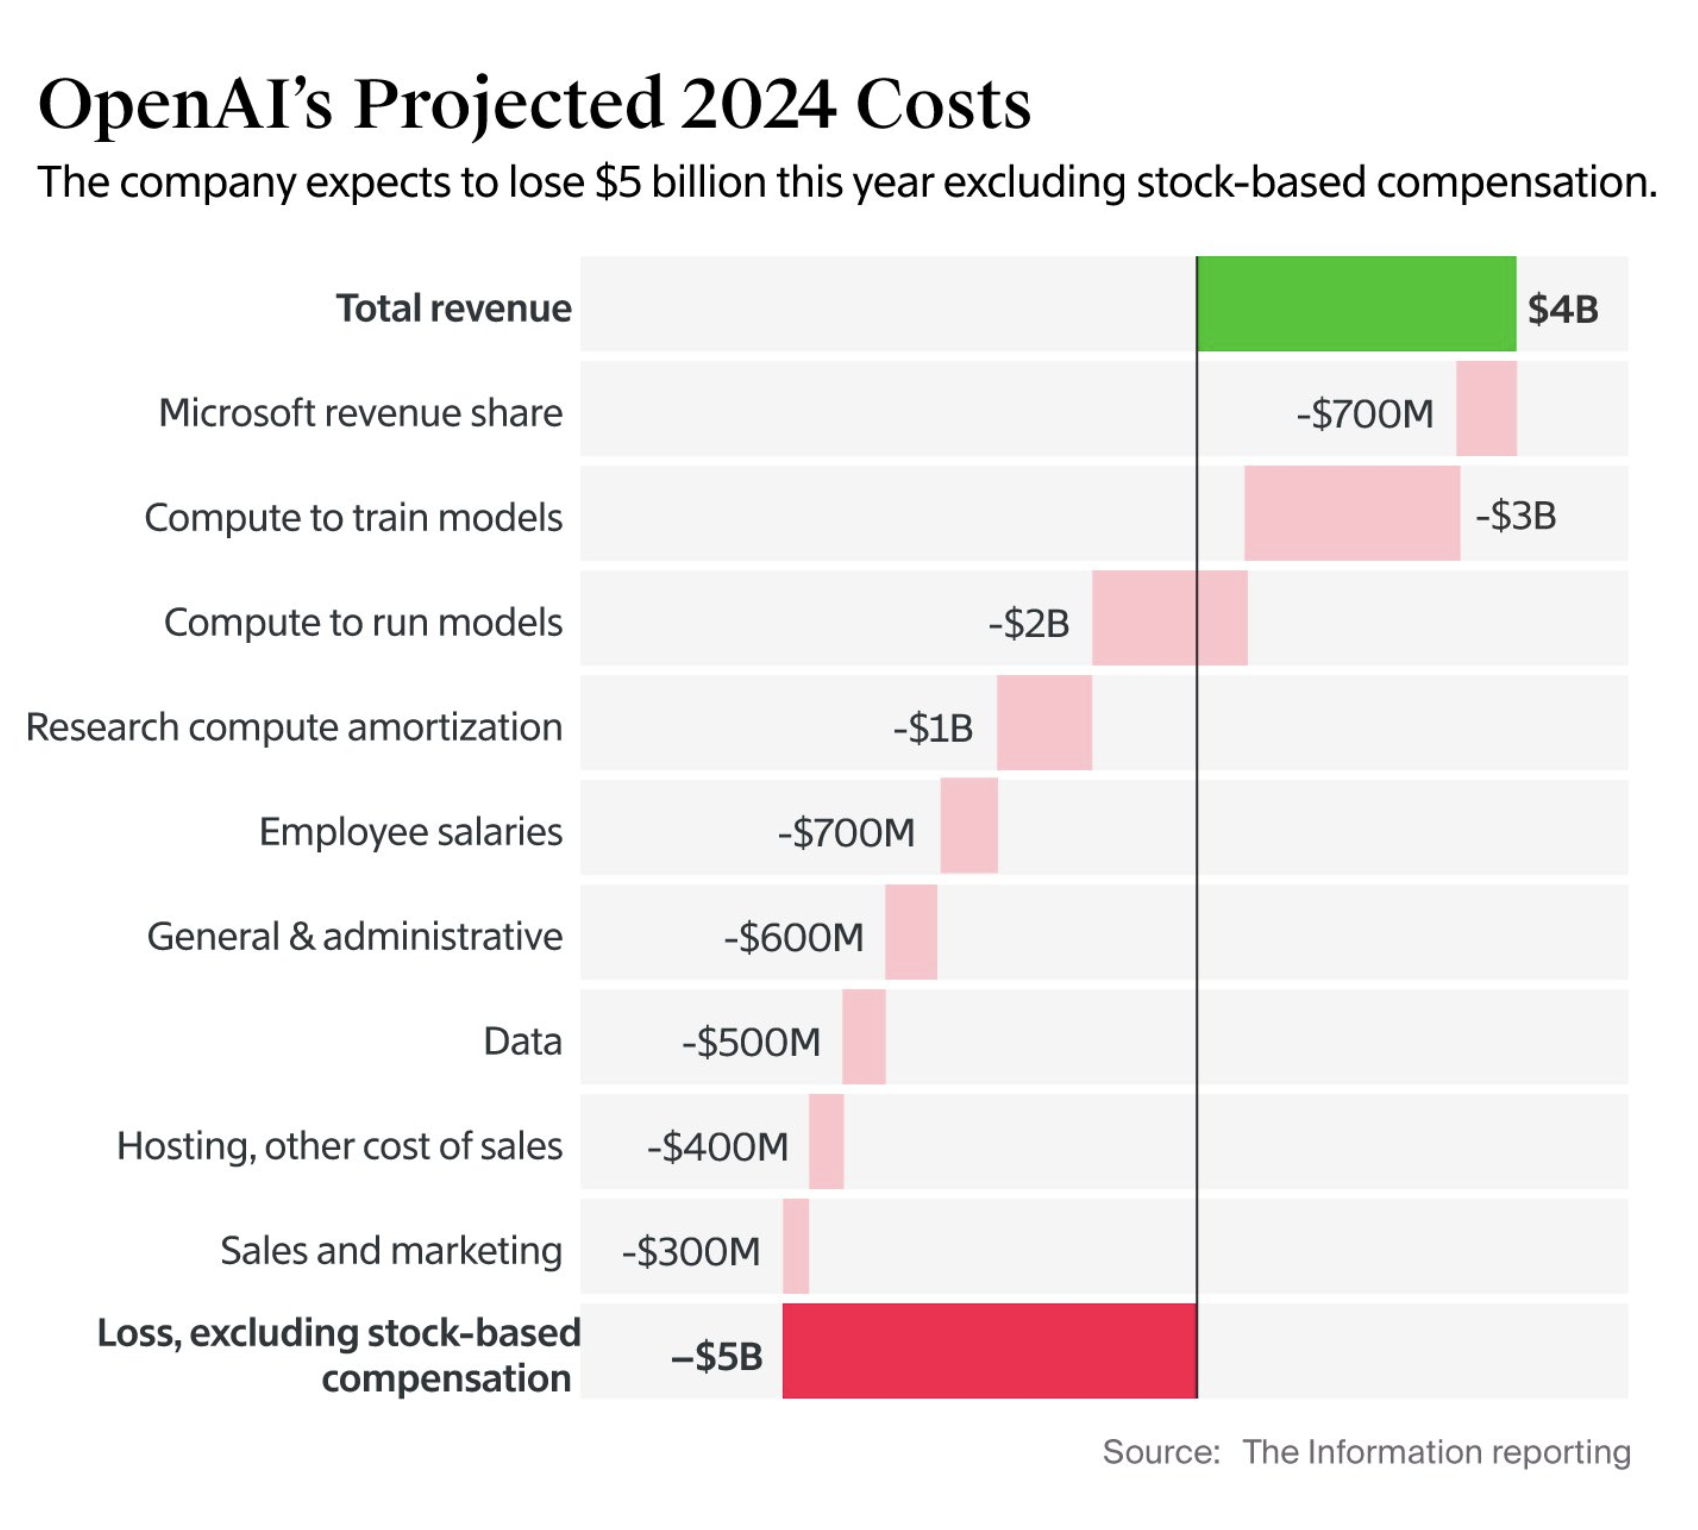
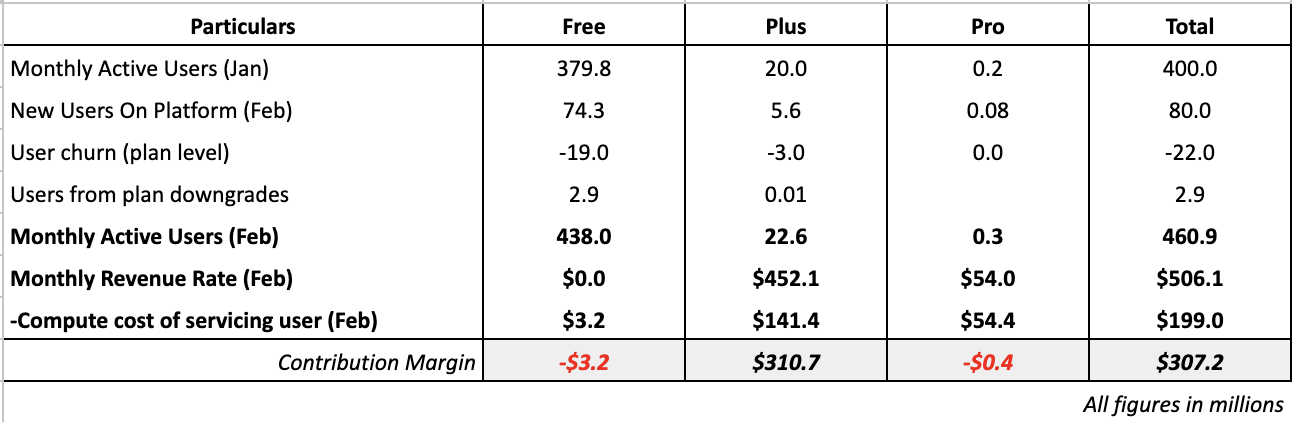
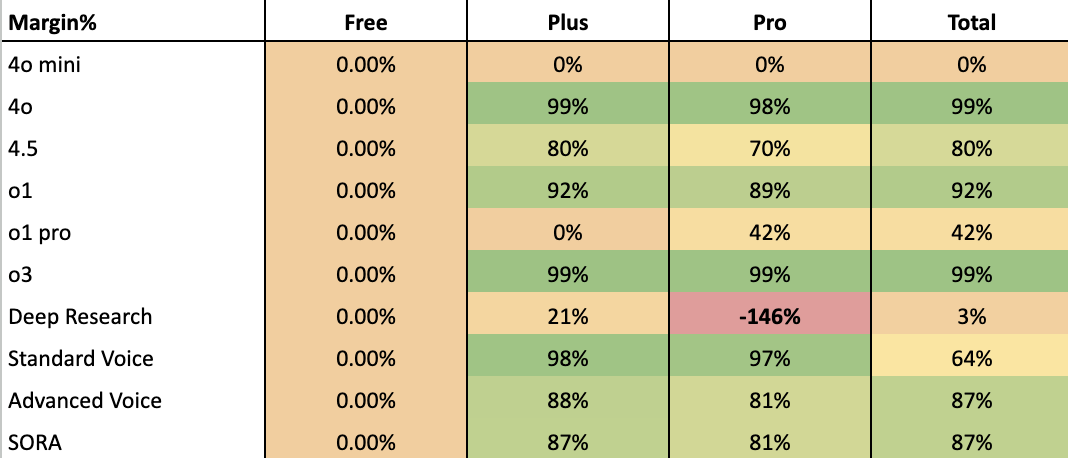
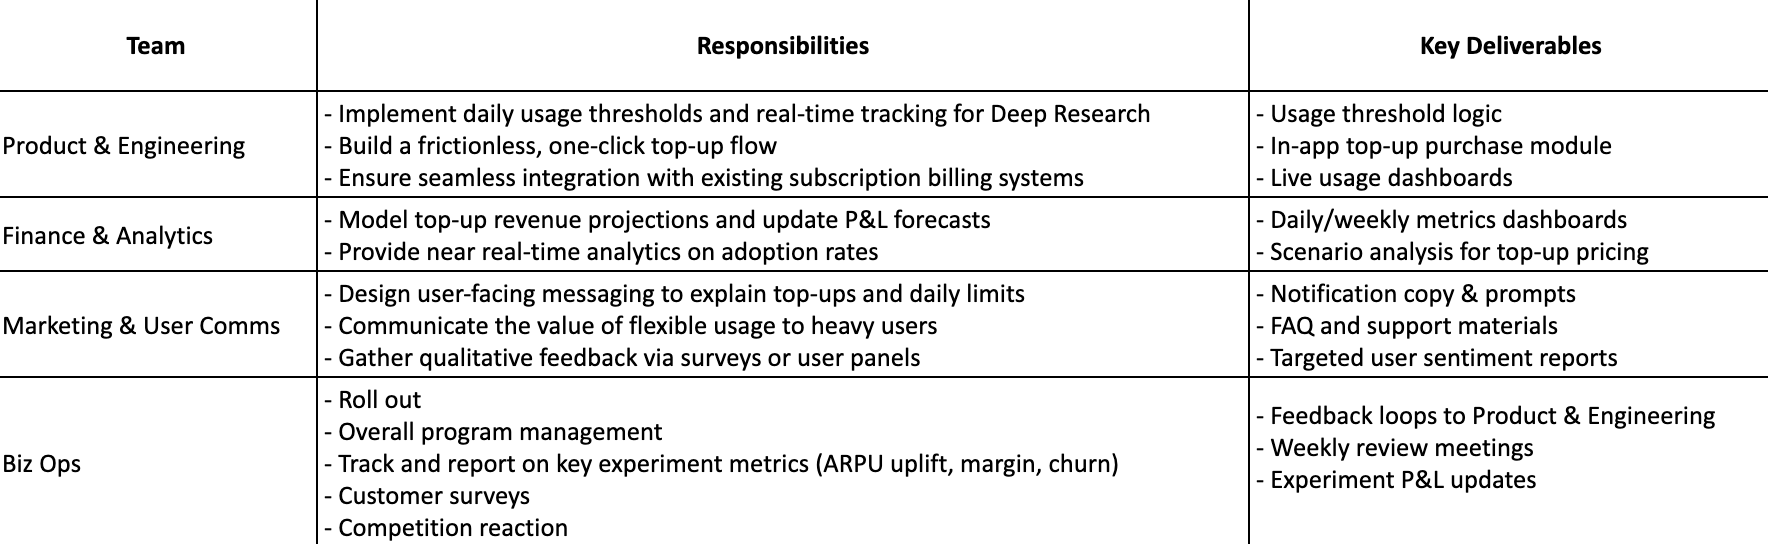
  • By pairing user sentiments with the hard data on margins and costs, we can craft pricing experiments that address user anxieties while still capturing incremental revenue from power users.
  • We should keep track of user sentiments across platforms like Reddit and X. This feedback loop helps ensure the final solution is both financially sound and user-loved. Given a frequent concern around competitive offerings, it is also important to keep a close track of how players like Grok and Anthropic respond.

4. Designing the pricing experiment

Our current consumer PnL indicates that a small cohort of heavy users, especially on Pro, significantly impacts margins. While a pure credit-based model might recapture costs, user sentiment reveals strong resistance to "constant metering."


Solution: a hybrid subscription + top-up approach


This preserves a flat monthly fee but prompts users beyond a certain usage cap to purchase additional "top up packs". This approach seeks to improve margins without alienating most subscribers.


FURTHER CUSTOMER SEGMENTATION FOR TARGET GROUP: My strong hunch is that even within the pro and plus users there is a strong pareto of users that are driving down the margins through heavy usage. To identify these high cost users we will look at monthly usage data (e.g., total queries, token consumption) at a user cohort level. Flag the top 5–10% whose average monthly usage is multiple times above the median. For these power users, break down which models and features (e.g., Deep Research) they consume most. Validate whether most margin leakage occurs among a small cohort. Once we have validated this, we will land on our target experiment cohort: Top 10% of Plus and Pro users based on total monthly token consumption.


EXPERIMENT CONSTRUCT


  1. Control Group: Continues using the existing subscription model with no additional charges or top-up prompts for Deep Research queries. Baseline daily usage limits remain unmetered or reflect existing caps with no enforced paywall.

  2. Test Group: Same Base Subscription ($20/month for Plus, $200/month for Pro). Added daily soft cap for Deep Research queries - 30/day for Plus, 100/day for Pro. Once users cross this threshold, they see a prompt to purchase additional usage packets.

Experiment Design and Top-Up Options

Selection Criteria

  • High-Usage Cohort: Identify the top 10% of Plus and Pro users by historical usage (token consumption/month). Only these heavy users are placed in the test group.
  • Randomization: Within that high-usage cohort, randomly assign half to "Test" and half to "Control," ensuring like-for-like comparison.

DURATION: 3 monthly billing cycles to account for natural usage fluctuations and churn patterns.


DETAILED USER FLOW:


  1. 1. Usage Monitoring
    • The system tracks daily queries for Deep Research models (o1, o1pro 4.5, 4o).
    • Each user has a free daily allowance tied to their tier (Plus vs. Pro).

  2. 2. Threshold Trigger
    • When a user's daily queries hit their threshold (30 for Plus, 100 for Pro), the system briefly notifies them: "You've reached your daily Deep Research limit. Would you like to unlock more queries today?"

  3. 3. One-Click Top-Up
    • Inline Prompt: A simple overlay or banner appears with the purchase details (e.g., "Unlock 50 more Deep Research queries for $5").
    • Stored Payment: If the user's card is on file, a single click completes the transaction. Otherwise, they're routed to a quick payment method setup.

  4. 4. Immediate Access
    • Upon successful payment, the daily query count resets, and the user can immediately continue with additional Deep Research queries.
    • No further gating or partial usage limit is shown unless they exceed the new packet capacity again.

  5. 5. End-of-Day Reset
    • Each day, a user's baseline usage is restored. If they need more than one packet in a day, they can buy multiple packets, although the prompt appears only once they exceed the purchased packet's capacity.

GOALS AND SUCCESS METRICS:


Goals


  • Top-Up Adoption Rate: >50% of users who cross the daily "Deep Research" threshold purchase a top-up.

  • ARPU Expansion: 15% increase in average revenue per user among the heavy-usage cohort (test group) vs. control.

  • Contribution Margin Improvement: +15 percentage points in contribution margin for Deep Research usage in the test group.

Check Metrics


  • Churn Rate: Incremental churn no more than +0.5% above control.

  • User Sentiment & NPS: No drop greater than 2 points in Net Promoter Score among top-usage users.

  • Usage Volume: Test group's total queries should not decline by more than 5% compared to control, indicating minimal "usage suppression."

  • Downgrade Frequency: Threshold: Less than +1% movement from Pro to Plus or paid to free relative to control, ensuring no mass exodus due to top-up annoyance.

  • Competitive Attrition: Threshold: No material surge (> 1% extra) in cancellations citing direct competitor alternatives

ALIGNMENT AND RESPONSIBILITIES ACROSS TEAMS

Team Alignment and Responsibilities

GAPS


This experiment design is not perfect, and if I had more time and info I would spend more time on the following:


  • Size of Prize: I would do a detailed analysis on what the size of prize at scale for this initiative would be. This would help prioritize resources and team members on this initiative.
  • Future Model Timing: It might be best to tie these changes to the launch of a new or improved model (e.g., GPT-5). Bundling a pricing update with exciting new features can ease user friction and frame it as a net benefit, not just an extra fee. But running an experiment on current users and products to predict what behaviour might look like for a new model is paramount for decision making. This will help time and design a strong rollout plan


*Full Disclosure - For the purpose of this analysis, I used ChatGPT, Grok, and Claude as brainstorming and research partners.

---X---